 HEY MR. FACTS
Official data. Receipts included.
Numbers don't take sides.
Short, sharp charts on how America is really doing, built only from official sources and shown with every link. Disagree? Bring a dataset.

Latest receipts
Fresh off the printer
 Debt
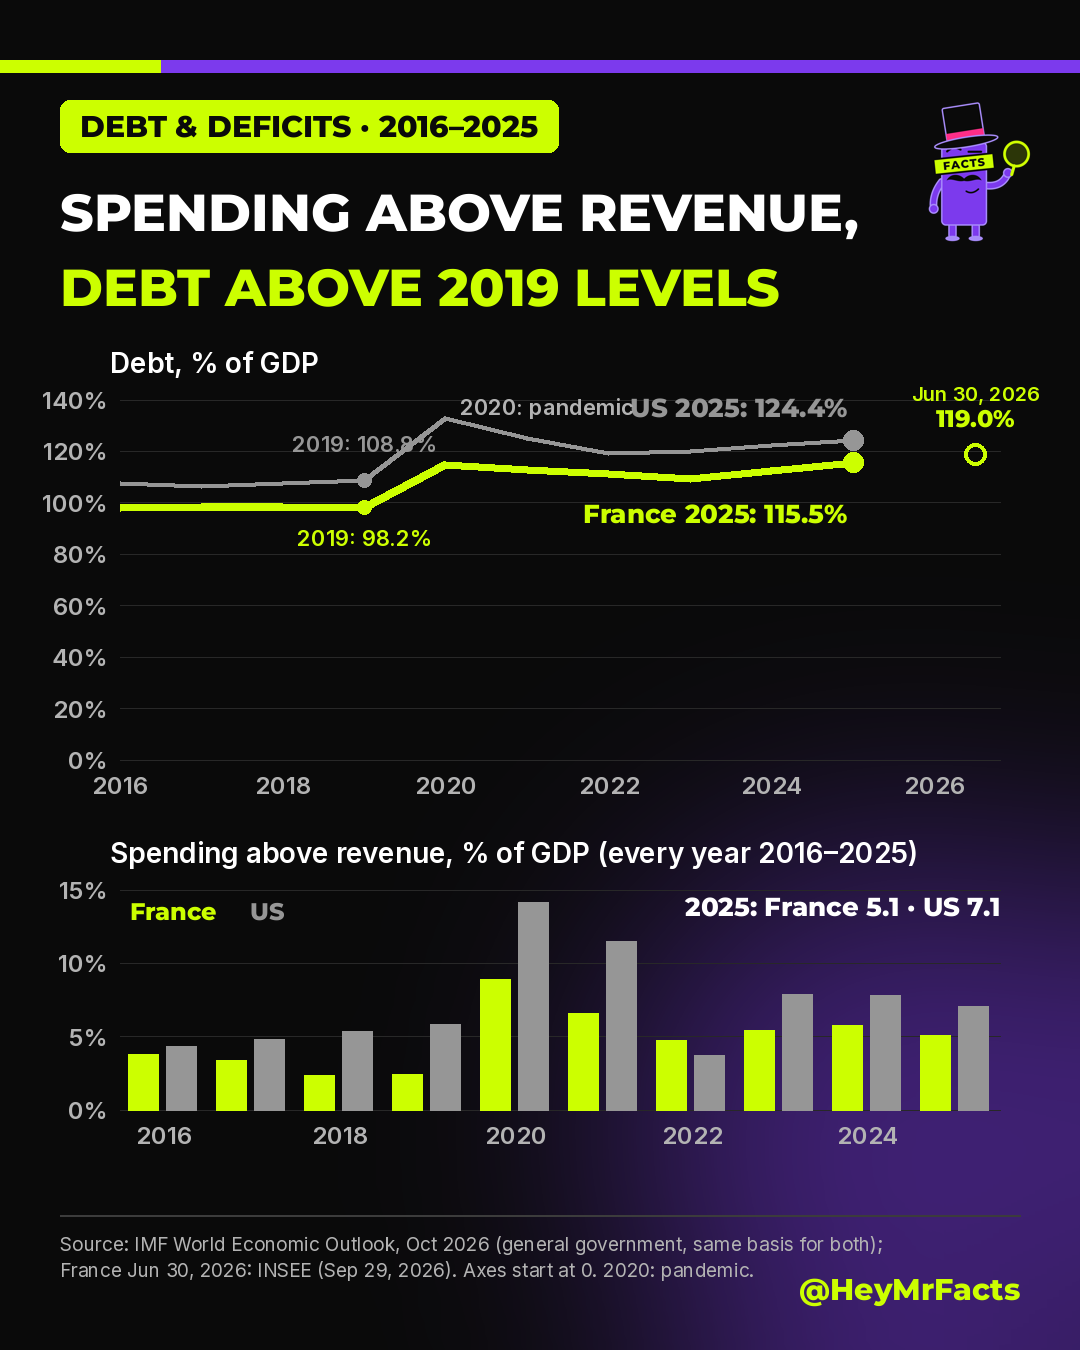
France vs US debt
Both ran deficits every year since 2016; debt is above 2019 levels in both (115.5% and 124.4% of GDP in 2025).
See the receipt →
 Dollar
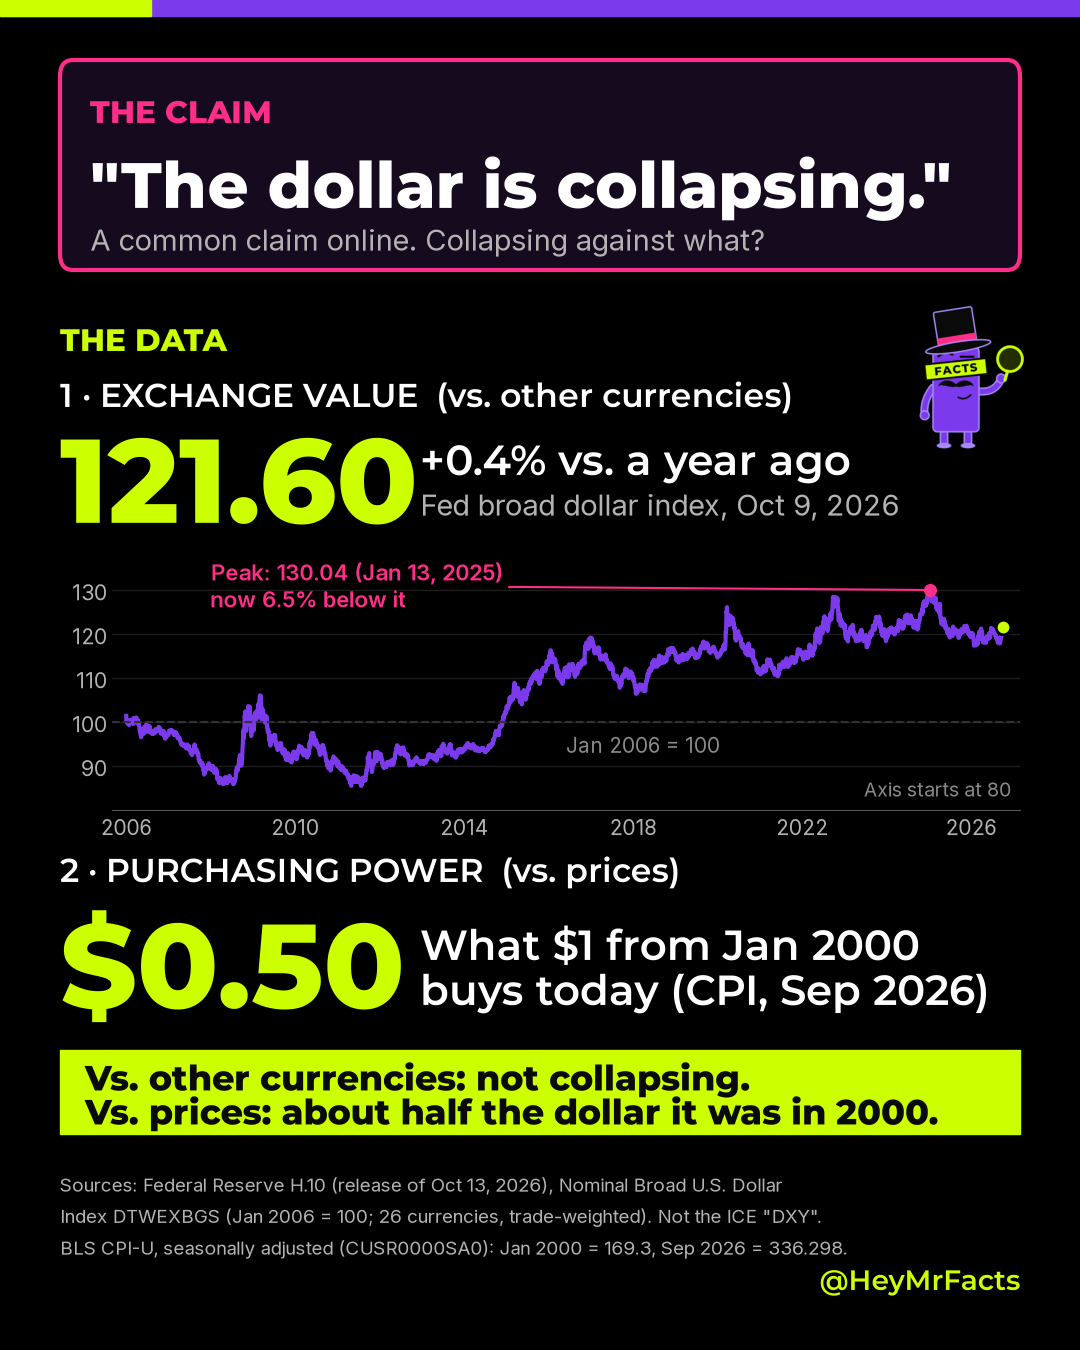
“The dollar is collapsing.” Against what?
Vs. other currencies: not collapsing (121.60, up 0.4% in a year). Vs. prices: $1 from 2000 buys about $0.50.
See the receipt →
 Government costs
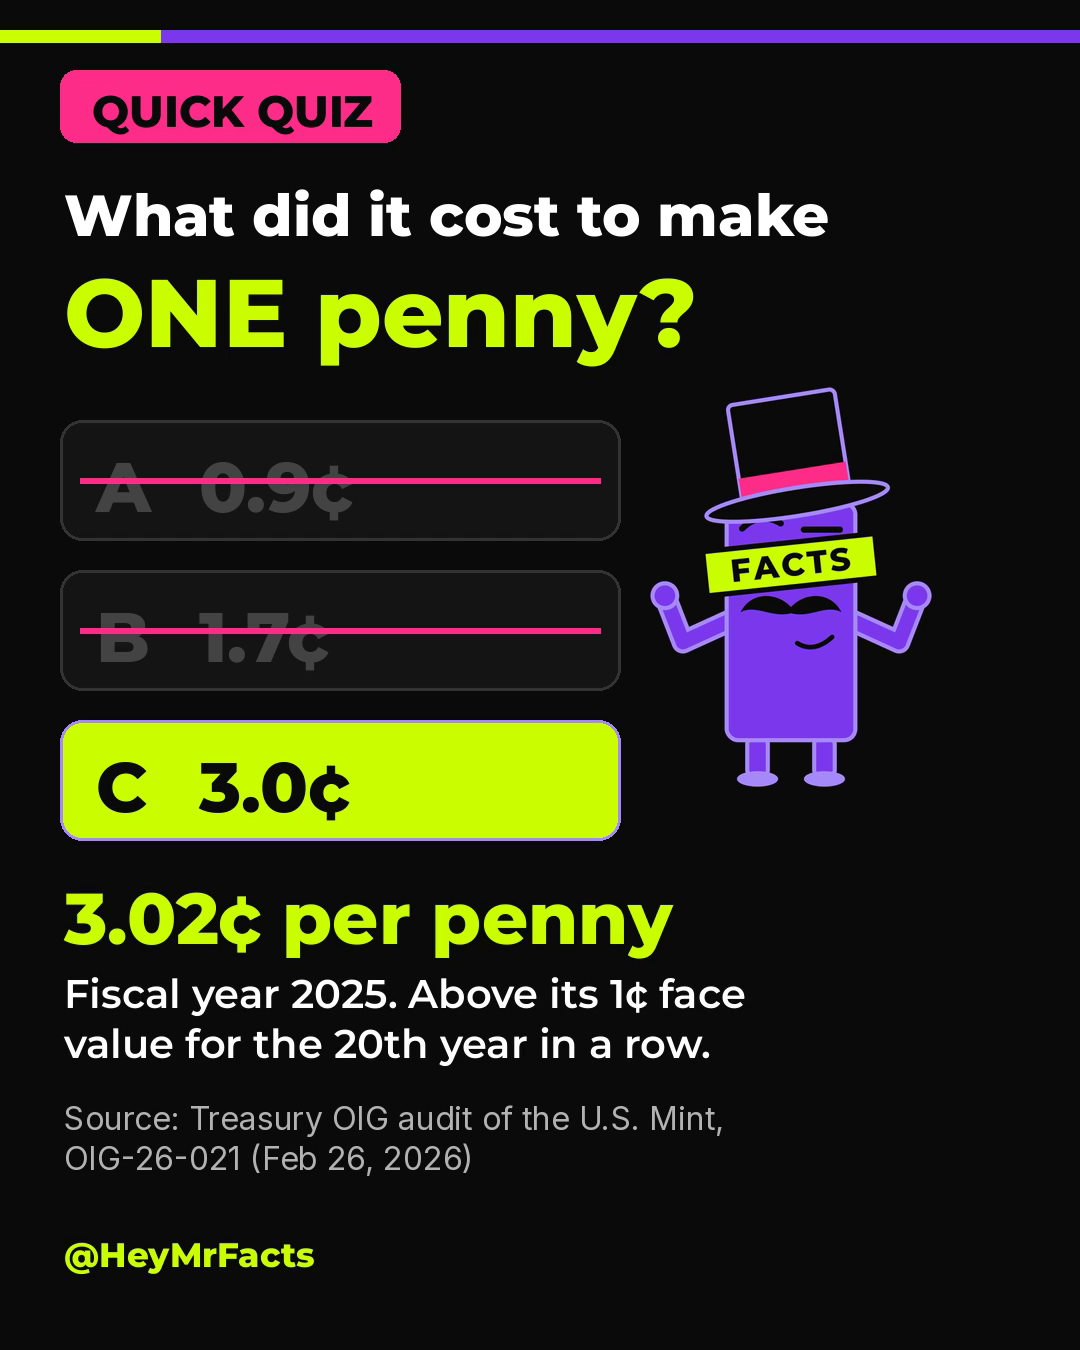
What does one penny cost to make?
3.02¢ per penny in fiscal 2025: above its 1¢ face value for the 20th year in a row.
See the receipt →
How we work
No receipts, no post.
Official sources only
Federal agencies, statistical offices and international bodies. No blogs, no screenshots of screenshots.
Every chart linked
Each post gets a receipts page with the exact dataset, series and date pulled.
Double-checked
All our numbers are double-checked against official data and outside analyses.
Public corrections
Wrong is wrong. Errors are fixed in the open and logged. Our policy.
Follow
Get the charts
New charts every week. Quality over quantity.