Receipts

Show your work.

Every post gets an entry: the chart, the exact claim, the source links and where we posted it. Newest first.

All our numbers are double-checked against official data and outside analyses.

Receipt details

Published Oct 20, 2026 · Theme: Spending and debt · View the post on X

France vs US debt
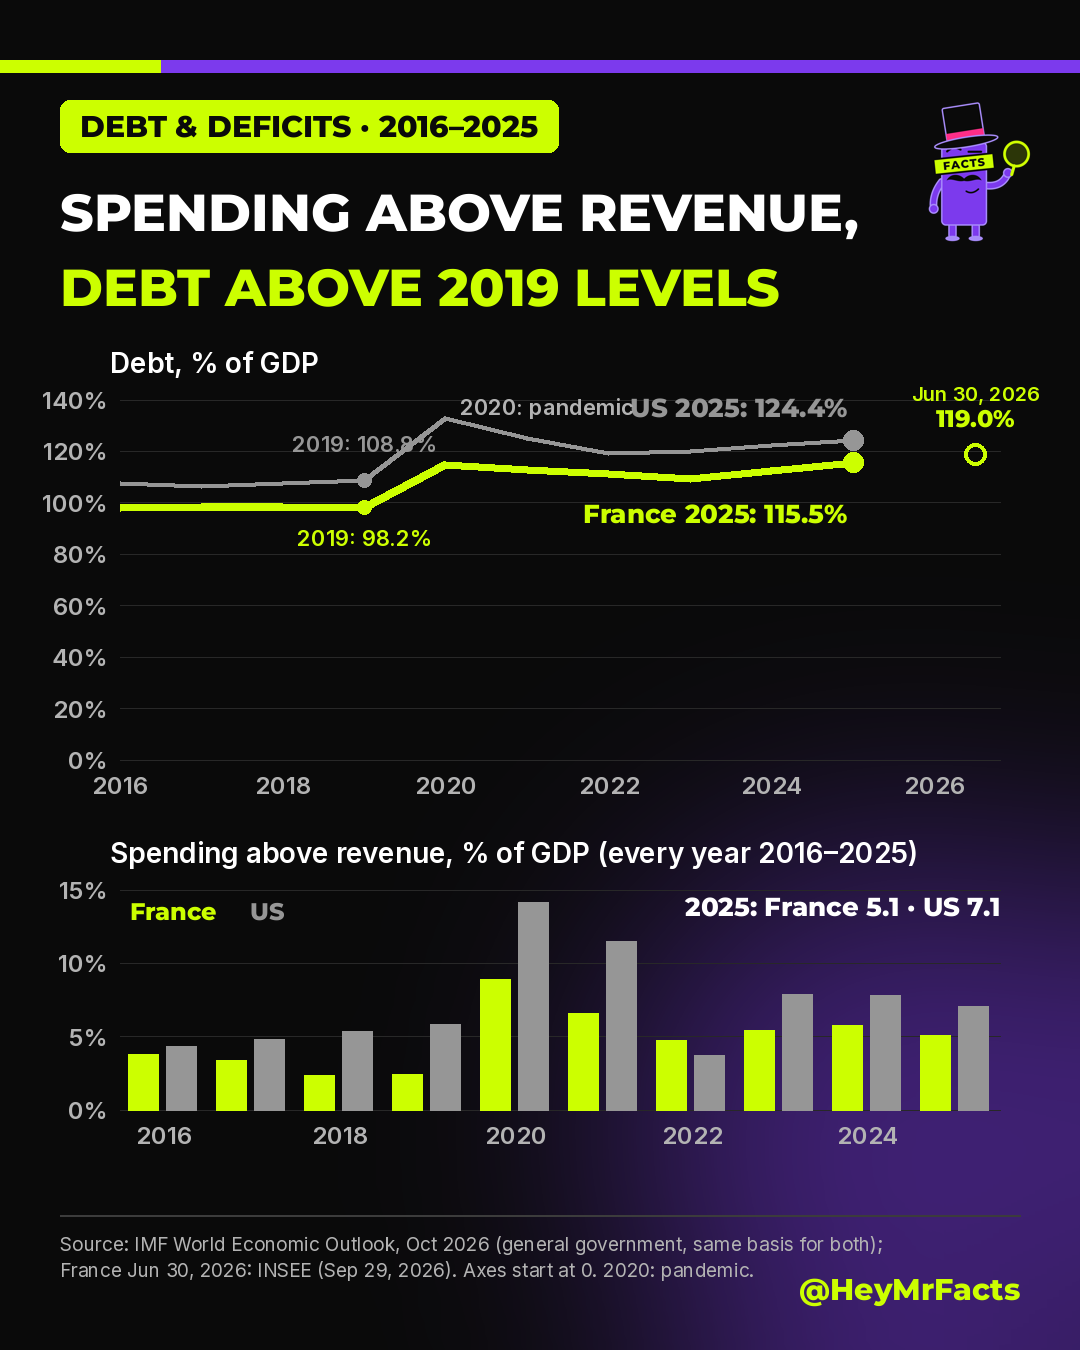
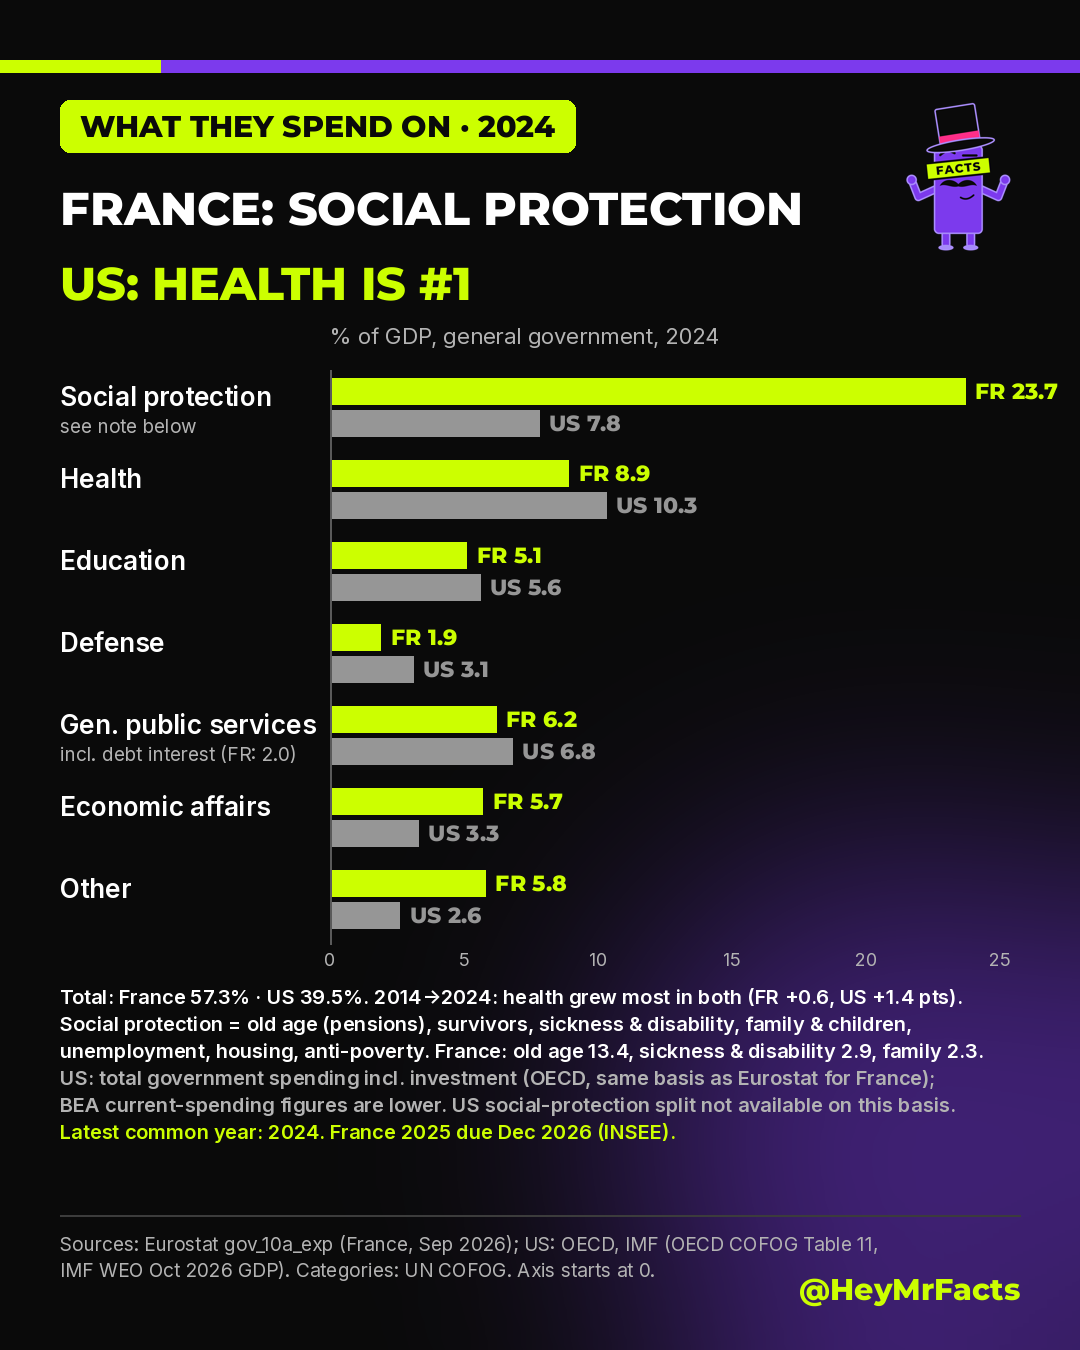
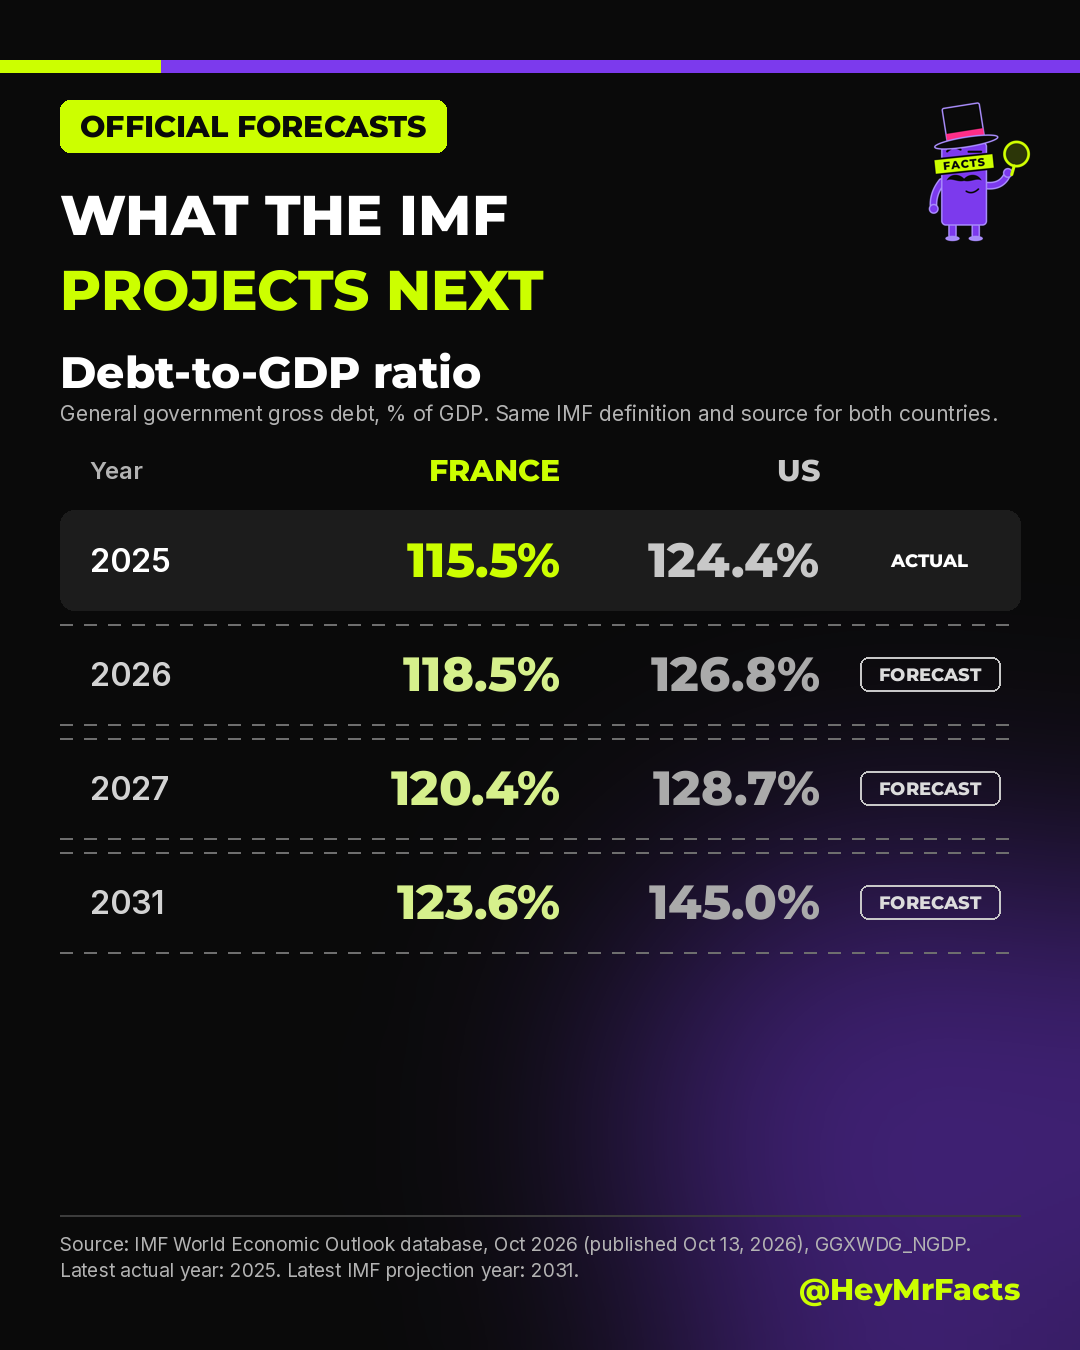
Chart 1: general government gross debt and annual budget gap as % of GDP, France vs US. 2025 gap 5.1% France, 7.1% US; debt 115.5% and 124.4%, vs 98.2% and 108.8% in 2019. Chart 2: government spending by function in 2024 as % of GDP. France's largest line is social protection at 23.7%, of which old age 13.4%. US largest line is health at 10.3%. Chart 3: IMF projections of general government gross debt to 2031: 123.6% of GDP in France and 145.0% in the US.
The claim
France and the US have both spent more than they collected every year since 2016; debt is above its 2019 level in both.
Key figures
Budget gap, 2025: 5.1% of GDP (France), 7.1% (US).
General government gross debt, 2025: 115.5% of GDP (France), 124.4% (US); 2019: 98.2% and 108.8% (IMF).
Spending by function, 2024: France's largest line is social protection at 23.7% of GDP, over half for old age (13.4%). In the US, health leads at 10.3%.
IMF projection for 2031: debt at 123.6% of GDP (France) and 145.0% (US).
Sources
IMF World Economic Outlook, Oct 2026: general government gross debt (GGXWDG_NGDP), published Oct 13, 2026
IMF World Economic Outlook, Oct 2026: general government net lending/borrowing (GGXCNL_NGDP), used for the budget gap
INSEE, France public debt at end of Q2 2026 (published Sep 29, 2026)
Eurostat gov_10a_exp, general government expenditure by function (France)
OECD, annual government expenditure by function (COFOG), Table 11 (US, dollars), divided by IMF WEO Oct 2026 GDP (our calculation)
Method
Debt and gap use the IMF general government definition for both countries (US includes state and local government). Latest actual year 2025; latest IMF projection year 2031. Spending categories follow the UN COFOG classification. Axes start at 0; 2020 reflects the pandemic.
Context in the post
France's Oct 17 cost-of-living and budget protests drew about 550,000 (Interior Minister, per press reports) or 800,000 (CGT union).
Where we posted it
X post
Corrections
None.

↑ Back to all receipts

Published Oct 19, 2026 · Theme: The dollar · View the post on X

“The dollar is collapsing.” Against what?

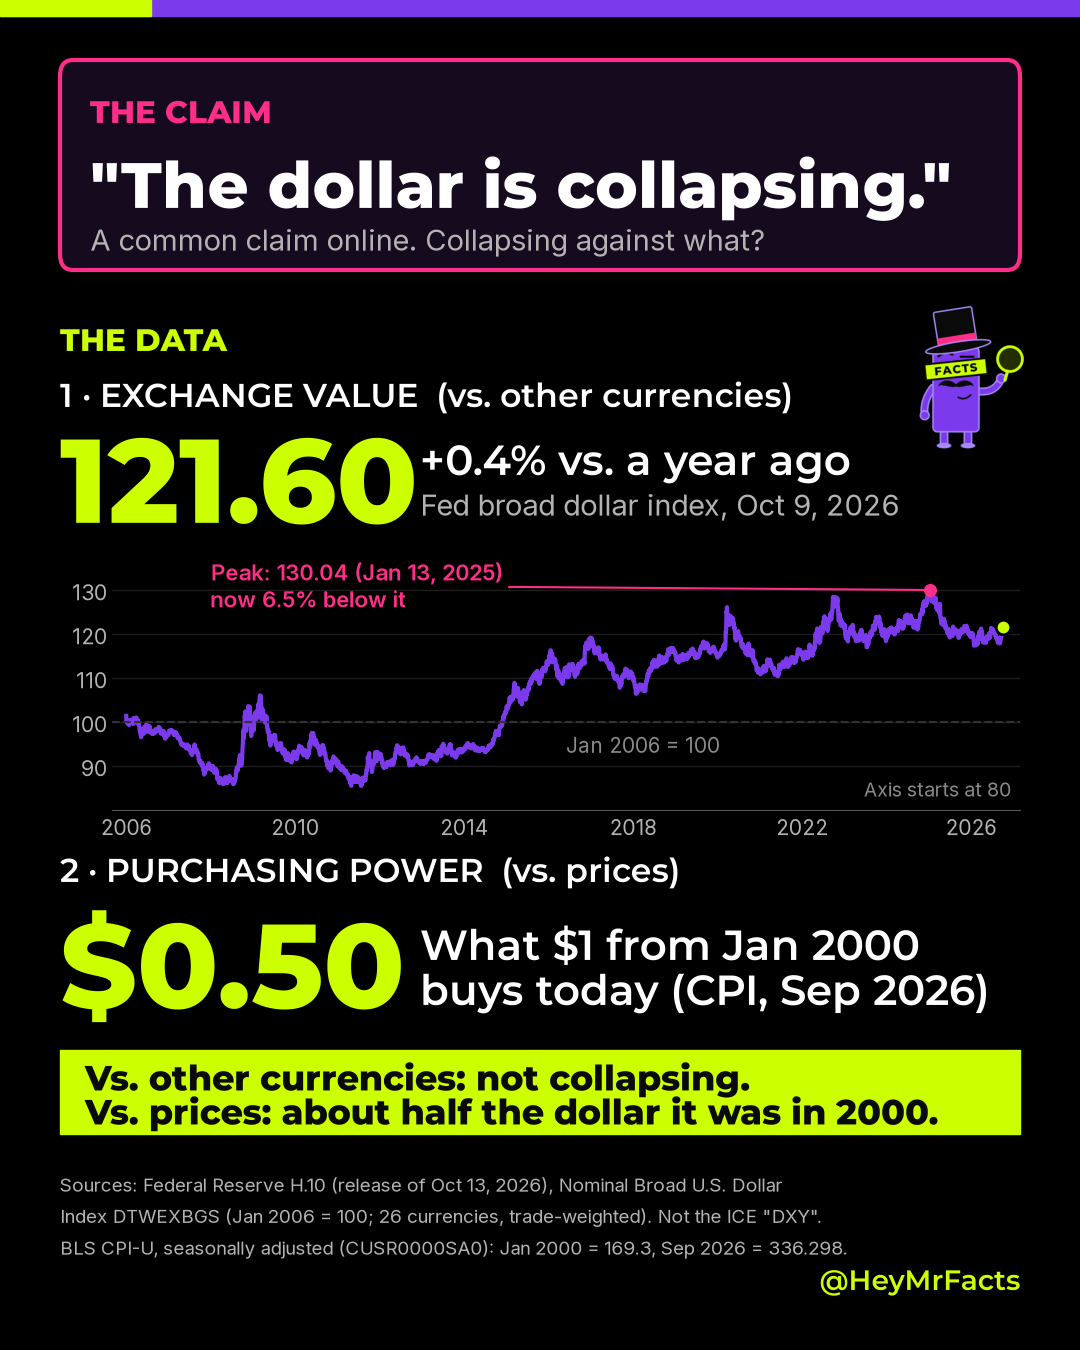
Claim vs data card. Exchange value: Fed broad dollar index 121.60 on Oct 9, 2026, up 0.4% vs a year ago, 6.5% below its Jan 13, 2025 peak of 130.04; line chart 2006 to 2026, Jan 2006 = 100. Purchasing power: $1 from Jan 2000 buys $0.50 today (CPI, Sep 2026).
The claim
“The dollar is collapsing.” A common claim online. Collapsing against what?
Verdict
Vs. other currencies: not collapsing. Vs. prices: about half the dollar it was in 2000. Exchange value and purchasing power are two different questions.
Key figures
Exchange value: Fed Nominal Broad U.S. Dollar Index (Jan 2006 = 100, 26 trade-weighted currencies) 121.6023 on Oct 9, 2026 vs 121.0902 on Oct 9, 2025 (+0.4%). Peak 130.0413 on Jan 13, 2025; now 6.5% below it.
Purchasing power: BLS CPI-U, seasonally adjusted, 169.3 in Jan 2000 vs 336.298 in Sep 2026, so $1 then = $0.50 now.
Sources
Federal Reserve H.10, foreign exchange rates (release of Oct 13, 2026)
FRED: Nominal Broad U.S. Dollar Index (DTWEXBGS)
BLS CPI-U, all items, seasonally adjusted (CUSR0000SA0)
Method
This is the Fed's broad index, not the ICE “DXY”. Chart axis starts at 80.
Where we posted it
X post · receipts reply 1 · receipts reply 2
Corrections
None.

↑ Back to all receipts

Published Oct 14, 2026 · Theme: Quick quiz · View the post on X

What does one penny cost to make?

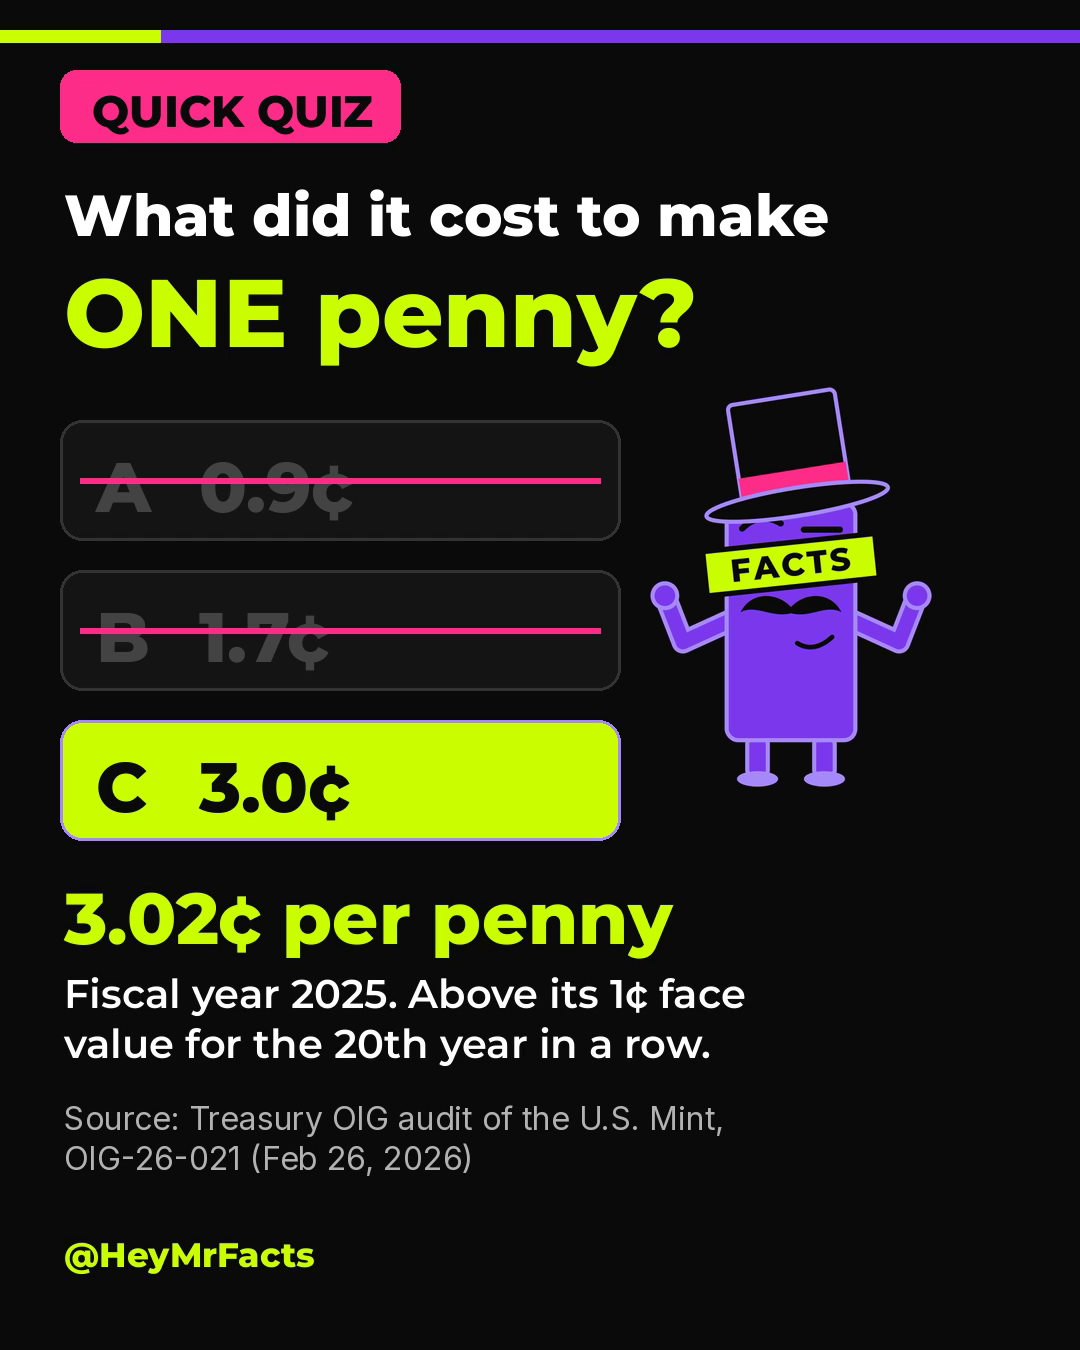
Quiz reveal frame: What did it cost to make ONE penny? A 0.9 cents and B 1.7 cents struck out; C 3.0 cents highlighted. 3.02 cents per penny, fiscal year 2025, above its 1 cent face value for the 20th year in a row. Source: Treasury OIG audit of the U.S. Mint, OIG-26-021.
The question
What did it cost the U.S. Mint to make a single penny in fiscal year 2025? (A 0.9¢ · B 1.7¢ · C 3.0¢)
Answer
C: 3.02¢ per penny in fiscal year 2025, above its 1¢ face value for the 20th year in a row.
Sources
U.S. Treasury Office of Inspector General, Audit of the United States Mint's Financial Statements for Fiscal Year 2025 (OIG-26-021, Feb 26, 2026), unit-cost table
Where we posted it
X · TikTok · YouTube Shorts · Instagram
Corrections
None.

↑ Back to all receipts